Jeremy Cottino

Il est bien plus beau de savoir quelque chose de tout que de savoir tout d'une chose. [Blaise Pascal]

Using Traffic Lights in Project reporting

9 comments
Following my previous article on Earned Value Management (Project Management: Understanding Earned Value Management), here is a very simple technique that probably many of us are already using, which helps to clearly define project health on an easy way.
Traffic Lights definition and usage
These indicators are generally used in summary reporting (the status of activities within a project), or in program reporting (the status of projects within a program). They are particularly useful for giving management focus on activities or projects which require particular attention.
We sometimes use the term RAG for these indicators, stating for Red / Amber / Green.
The definitions of RAG indicators are agreed at the beginning of the project and used in reports and presentations regarding its status.
Examples
The project team has agreed to define following boundaries on Cost Performance Indicators. (Remember that CPI = EV / AC) The “traffic light” indicators could then be defined as:
  • Red if CPI < 80%
  • Amber if 80% ≤ CPI ≤ 95%
  • Green if CPI > 95%
Usage in Microsoft Project® (Project plan)
Here is an example of using traffic lights inside Microsoft Project®.
How can you implement such indicators in Microsoft Project ®?
  1. Create a new custom field for task, with type: Number,
  2. Select Custom attribute: Formula,
  3. Enter the following formula,
The result is:
  • 1 if SPI >=0.9,
  • 2 if 0.8=<SPI<0.9,
  • 3 if SPI<0.8

  1. Select display graphical indicators,
  2. Choose your graphical indicators.

Usage in Microsoft Office Excel (Project report)
Another example of traffic lights usage, an issue log in Excel, I have used the conditional formatting to color cells.

Here are the rules used for the conditional formatting.

Usage in Microsoft Office PowerPoint (Steering committee presentation)
The last example I wanted to show is the usage of traffic lights in PowerPoint presentations. Here is a print screen of one of my sides regarding my project cost status.
Overall project cost indicator is on top, and a more detailed presentation for Capex / expenses is given below.

Advantages of such technique
  • It is very intuitive and visual,
  • And very effective for summary reporting, or management presentations.

You should pay attention on following points
  • The values of the indicators must be agreed at the beginning of the project, and should be consistent with other projects
  • The summary nature of the indicators can be misleading (i.e. how “green” is an activity, what is the trend?)
  • They do not provide sufficient information to allow diagnosis and interpretation, without discussion.

Consequences and actions
  • Maintain the performance of projects/activities which are “green”,
  • Diagnose the risks and issues of projects/activities which are “amber” and take appropriate action to remedy problems,
  • Diagnose and remedy issues with projects/activities which are “red”, seeking management support and endorsement as appropriate.

9 comments :

Post a Comment

Note: Only a member of this blog may post a comment.

Hide SharePoint 2007 list column from edition using JavaScript

No comments
Here is a quite simple way to hide some column in a SharePoint list when you create/edit/view a list item, using JavaScript.
Here is my list definition:
I just have Title and MyHiddenColumn columns.

Here are the 4 pages where my list can be viewed and edited.
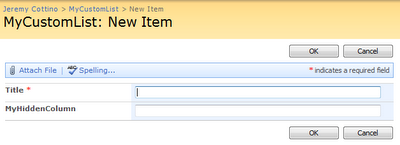
Create new item:

List view:

Display item:

Edit item:

What I want to do is to hide the MyHiddenColumn column (this could be useful to manage confidential information related to a list item).
To hide this column to the list view, I just have to remove the column from the view (easy).
To hide the column on the 3 other screens, I will use the following JavaScript code, included in the page:

<script language="javascript" type="text/javascript">
_spBodyOnLoadFunctionNames.push("hideFields");

function findacontrol(FieldName) {

   var arr = document.getElementsByTagName("!");

   // get all comments
   for (var i=0;i < arr.length; i++ )
   {
      // now match the field name
      if (arr[i].innerHTML.indexOf(FieldName) > 0) {
          return arr[i];     
      }
   }
}

function hideFields() {

   var control = findacontrol("MyHiddenColumn");
   control.parentNode.parentNode.style.display="none";
}

</script>
Where MyHiddenColumn is the name of the column I want to hide.
You can edit the page using Microsoft Office SharePoint Designer.

Save your change.

The result is then:
Create new item:
Display item:
Edit item:

Not so stupid question now, how can I edit this hidden field? The solution is Data Sheet view:

If you ensure that standard users cannot use another view than the default one (without this column displayed), this is a simple solution to add confidential information to a list item without creating a second list.

No comments :

Post a Comment

Note: Only a member of this blog may post a comment.